Make your Load Test run faster
In this extra credit exercise, we will show you how to make your pgbench transactional workload faster. By faster, we mean we want to complete more transactions in the same amount of overall time. To do so, we will need to identify potential bottlenecks and fix them.
First, let’s identify our current baseline showing the number of transactions per second our pgbench workload performed. Go to your MobaXterm window and look at how many tps (transactions per second) it reported for the 200 user pgbench load test you ran in the last module.
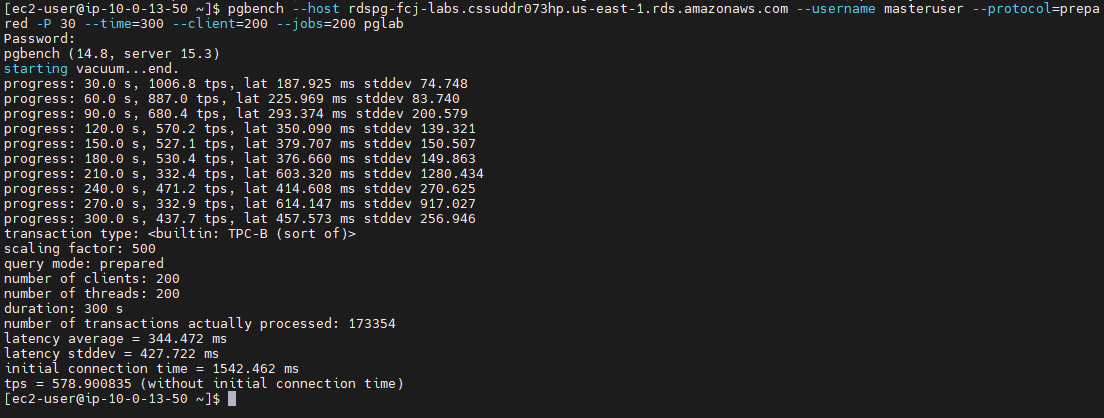
In the last two lines of the screenshot above, we see that our transactional workload was able to do approximately 578 transactions per second (tps). This is our baseline. The 578 tps was done on an db.t3.medium instance. If your lab environment uses a different instance type, such as the db.t3.medium, you may see a different value.
Now, let’s analyze our performance. In general, you can look at database performance through both a micro and macro lens. At a micro level, you want to look at individual SQL statements and identify if any individual SQL statement is a candidate to be tuned. Performance Insights is a good tool for this kind of micro level analysis.
At a macro level, you want to look at performance metrics for the overall system. You do this to see if any of the key resources (such as CPU or Memory or IO) are being heavily taxed and becoming a bottleneck. The Monitoring metrics in the RDS Console (which are also available in AWS CloudWatch) are a good tool for this.
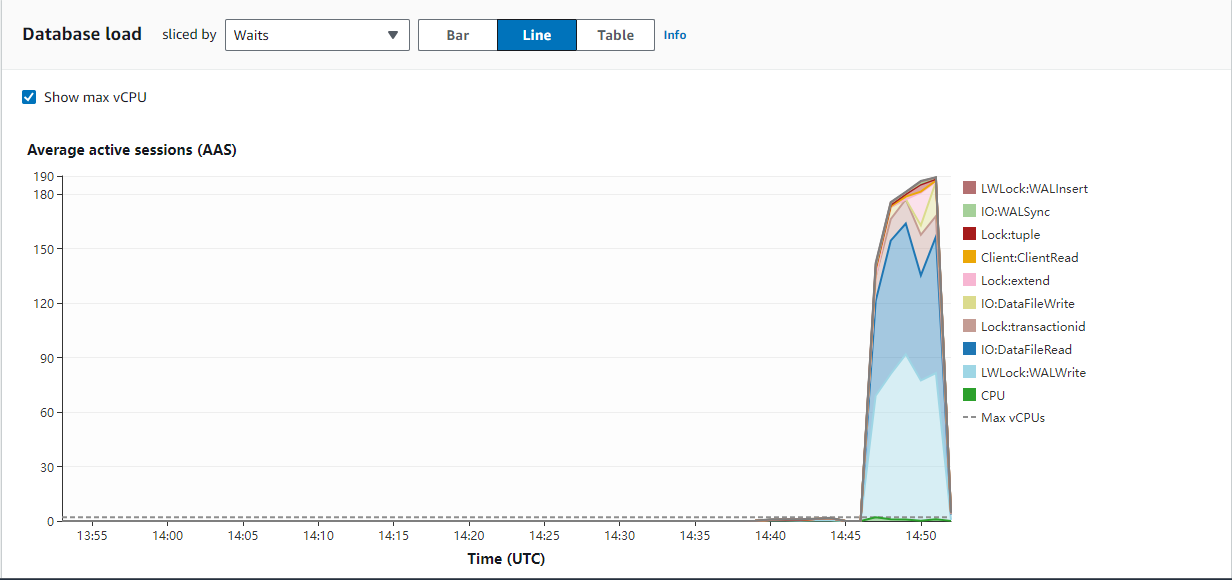
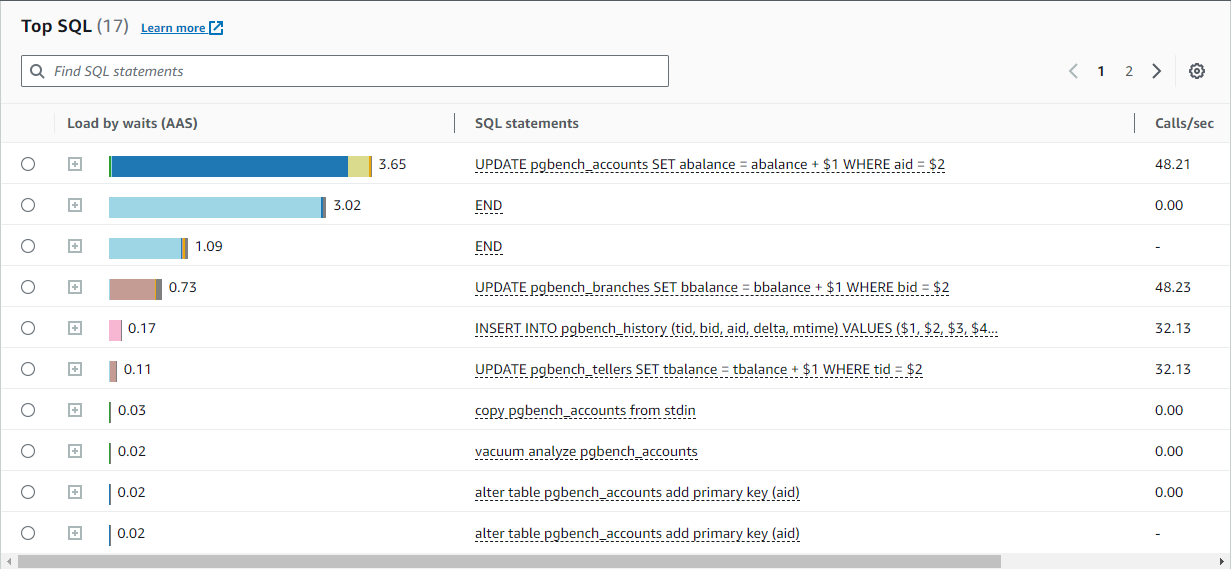
Let’s begin by starting with the micro level and looking at our workload in Performance Insights. If we zoom into the time period of the workload (you can select a custom time period by dragging across a range of times in the Database Load chart), we can notice that our top wait event is WALWriteLock and DataFileRead. We identified this as our top wait event because we can visually see that it occupies the most area in our chart—in other words, it has the most number of sessions waiting on this event (an average of 100 database sessions are waiting on that event). We can also identify that the SQL Statement that is associated with the WALWriteLock is END, which in PostgreSQL is the statement that closes/commits the transaction.
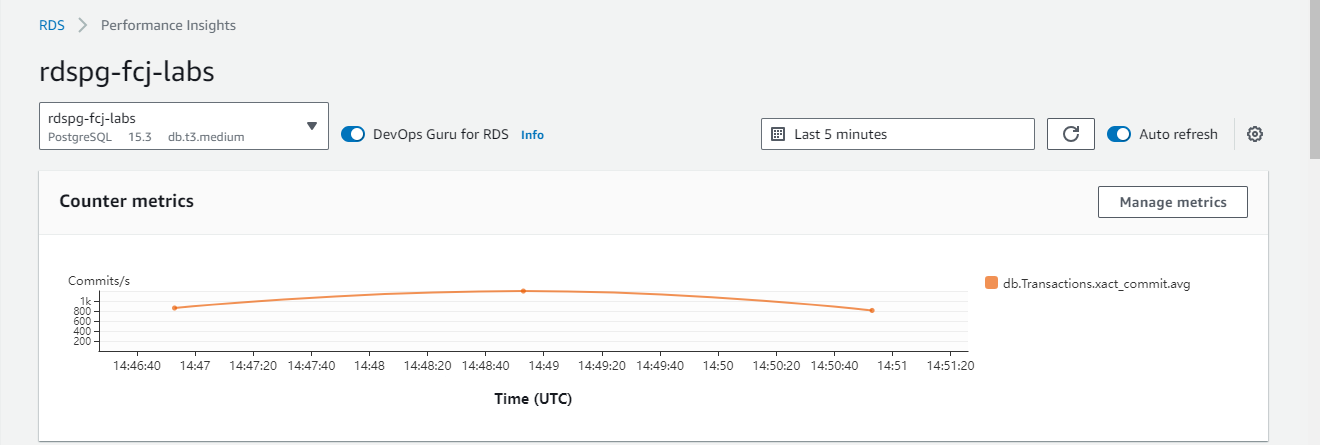
Counter metrics
Database load
Top SQL
You may not be familiar with the WALWriteLock wait event. The WAL is the Write Ahead Log, also known as the transaction journal. These files contain a persistent record of COMMITs and COMMITs can not return to the client until the WAL information is safely written to disk.
In our case, it looks like a large number of our 200 database sessions are backing up on the WALWriteLock and these sessions are waiting on this event when their transaction ENDs (commits). In other words, the system appears that it is not able to write the commits to disk fast enough.
Let’s now look at the macro level. To do so, navigate to the RDS Console and go to the Monitoring tab for your database. This will show us some system-wide metrics. Here is an example of what you will see:
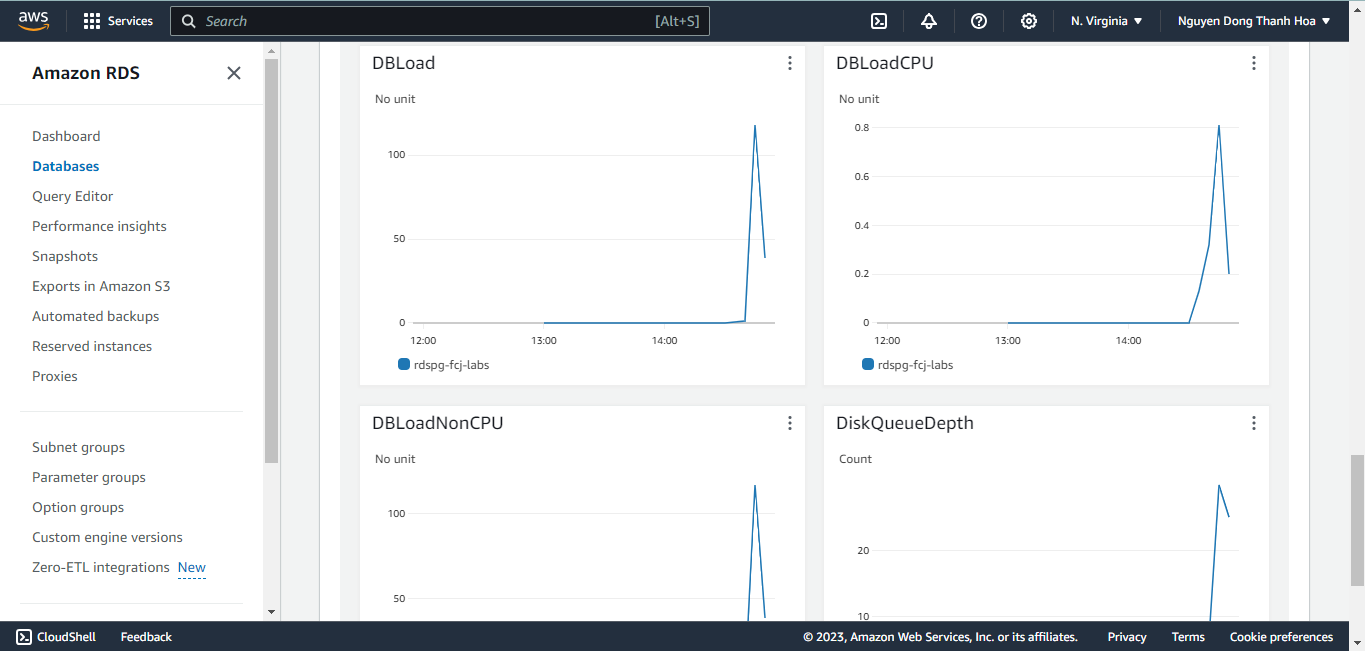
In the above chart, notice that CPUUtilization is not high even though we have 200 simultaneous connections on a 2 vCPU shape (db.t3.medium). So, we can say that it does not appear that CPU is a bottleneck.
Next look at some of the I/O metrics. In the chart above, notice that our DiskQueueDepth of waiting I/O requests has gotten large. Also, notice that our Write IOPS is close to 1000. If you remember from when we created the database, we decided to use Provisioned IOPS (io1) storage with 1000 IOPS (if you forgot, you can see the current specification for your storage under the Configuration tab. Look for the Storage Type and IOPS fields). So, it is looking like we might be hitting the current limits of our allocated storage. As a final confirmation, you can also page through the charts and find the Write Latency chart:
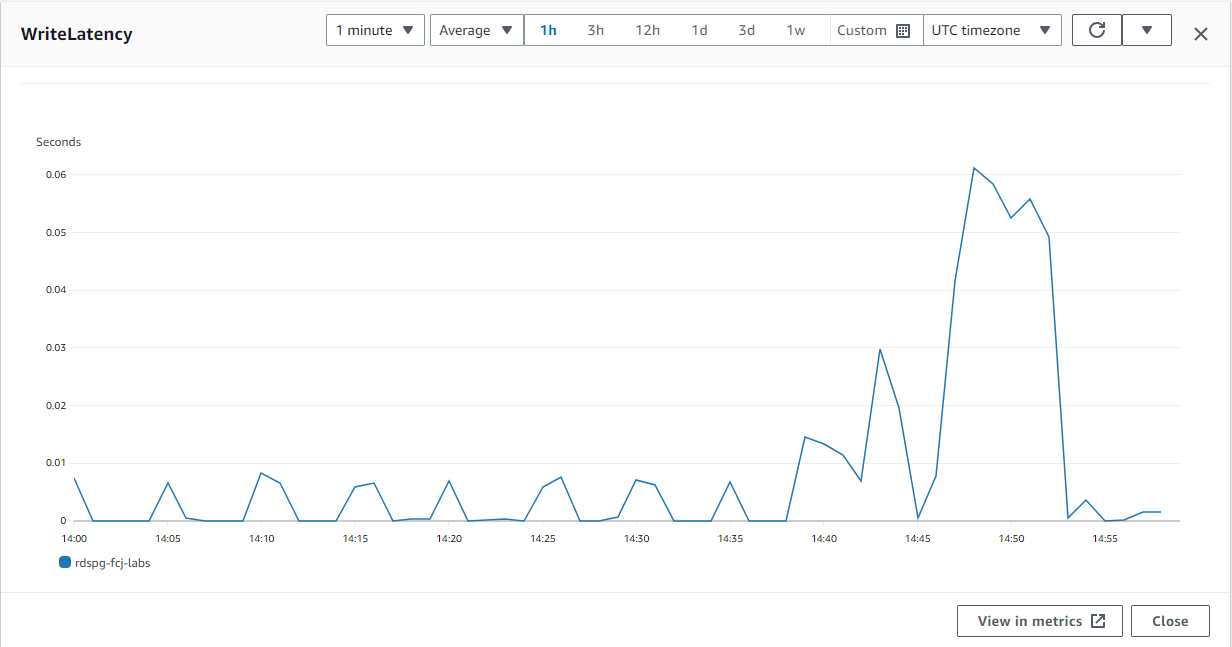
In the WriteLatency chart, we can see that the write latencies got very high during our workload. This kind of behavior would be inline with our hypothesis that we are hitting the limits of our configured storage (1000 IOPS), which causes the queue depth and write latencies to increase, and which causes writes to the WAL to take longer, and which causes more and more database sessions to have to wait longer and longer for the WAL to be written when they commit their transaction.
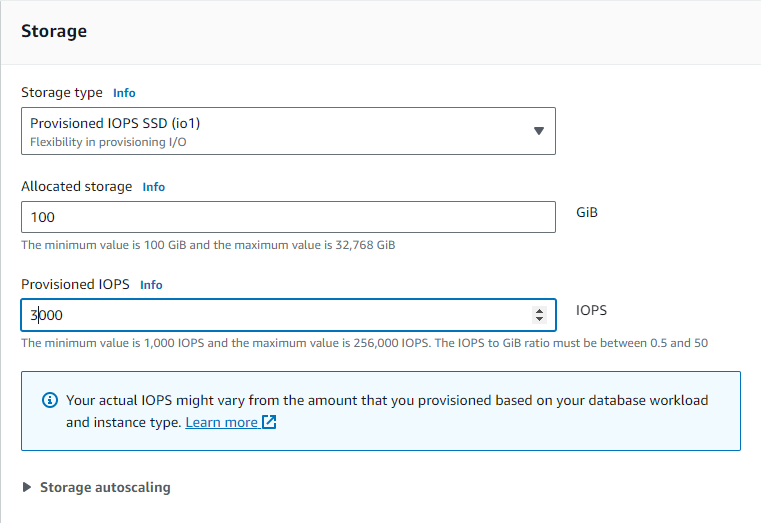
So, it looks like we can make our transactional workload run faster if we increase the IOPS. The good news is that the storage used by RDS is elastic. You can increase/decrease the IOPS configuration while the database runs. You can even change the Storage Type (from io1 to gp2 or vice-versa) while the database runs if you wanted.
Let’s modify our database and specify 3500 IOPS (up from its current value of 1000). To do so, click the Modify button at the top of the screen. On the modification screen, change the Provisioned IOPS field to 3500.
Then scroll down to the bottom of the modification page and click Continue.
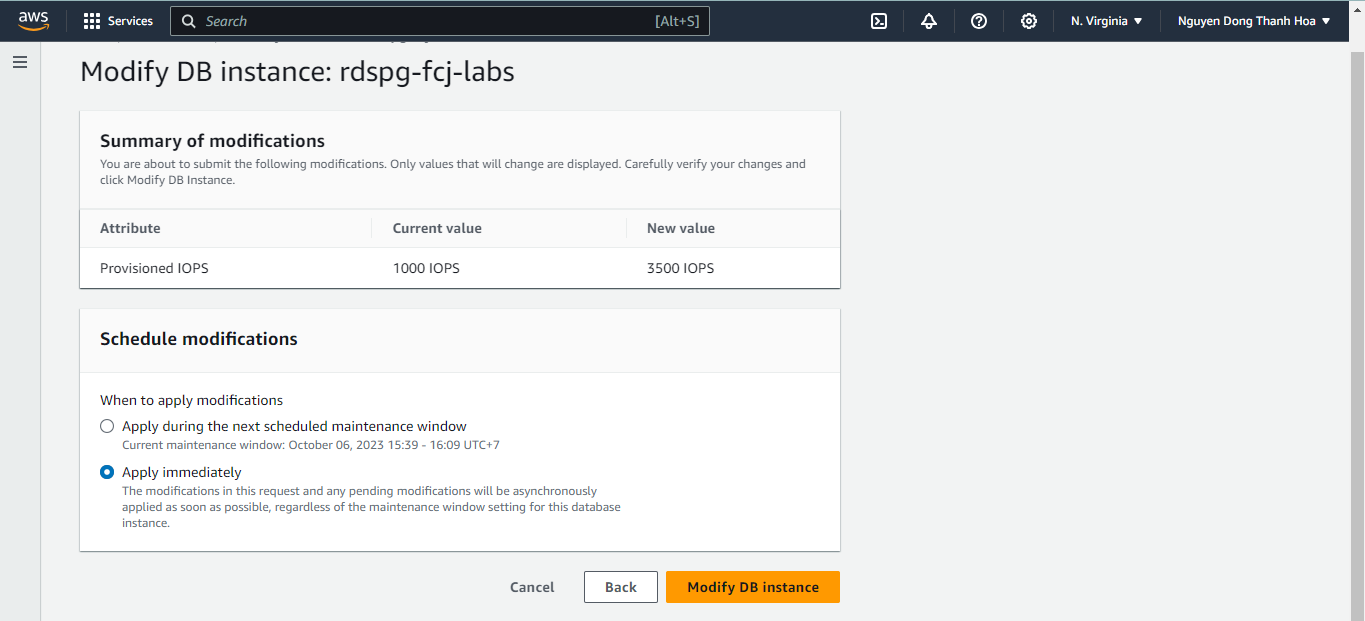
On the Summary and Scheduling page, be sure to choose Apply Immediately. Then click Modify DB Instance.
At this point, I suggest you go to the Databases List . The nice thing about the Databases List page is that it is easy to refresh the page so that you can track the changes in the Status.
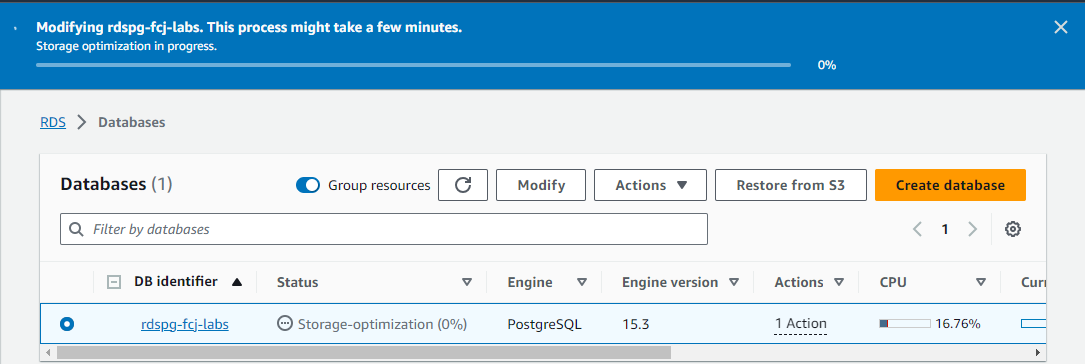
What you want to do is watch the Status while RDS changes the IOPS. The database will remain open while this happens. But we want to wait for the change to complete before we run our workload again. The process will take 10-15 minutes. You will see the status first say Modifying and then it will say Storage Optimization as the backend storage system optimizes itself to deliver on the new IOPS configuration.
(OPTIONAL) AWS CLI
Alternatively you can modify the IOPS of the instance using the AWS CLI as shown below:
Once the status returns to Available (or if you are impatient, wait at least until it says “Storage Optimization”), then return to Cloud9 and re-run the same workload as before:
pgbench --host <your database endpoint>--username masteruser --protocol=prepared -P 30 --time=300 --client=200 --jobs=200 <your dabase name>You should now see that the benchmark runs faster. For example, you should now see approximately 1300 transactions per second (up from 578 transactions per second before).
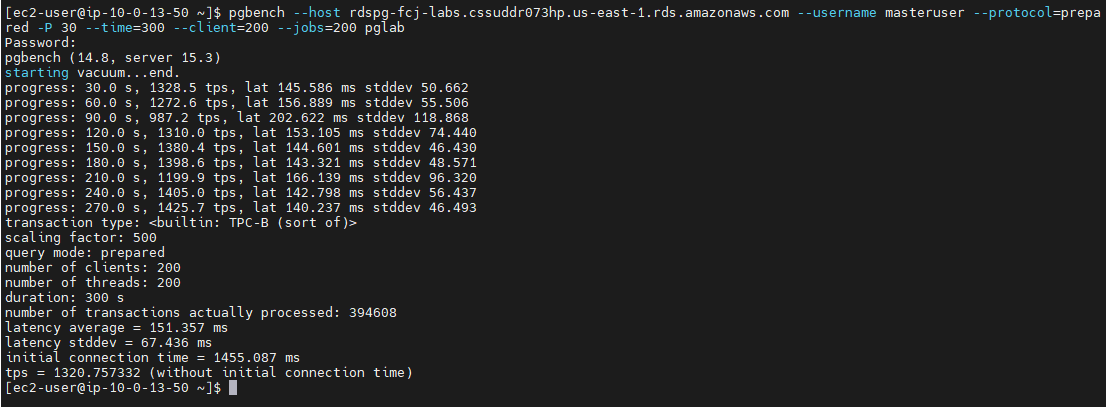
So, by increasing the IOPS capacity of the storage, you were able to make this stress test transactional workload run faster.
You are not limited to just using the RDS/CloudWatch metrics and Performance Insight. You can extend the default CloudWatch metrics with custom ones . You can use other PostgreSQL tools like the Dashboards built into pgAdmin. Or some PostgreSQL DBAs like to use the tool pgBadger to analyze database performance. To learn about how to use pgBadger with RDS PostgreSQL, read this .
In this workshop, We are using db.t3.mdedium instance type for handle labs. So, we might also see a large number of wait events for DataFileRead. The DataFileRead wait event could indicate that your instance type might not have enough memory to fit the working dataset into the database shared buffers. So, you could consider switching to an instance type with more memory as one possible way to address the DataFileRead waits.