Database Load Test
Data load test Performance under stress
Now let’s run a stress-test transactional workload on the RDS database instance. This workload will open up 200 connections to your database and each of those connections will continuously make updates to the tables. To launch the transactional workload, go back to the AWS CLI and run this command:
pgbench --host <your database endpoint>--username masteruser --protocol=prepared -P 30 --time=300 --client=200 --jobs=200 <your dabatase name>
This will start 200 concurrent client sessions that will execute the pgbench benchmark workload against the database specified by the
Let’s revisit some of the dashboards we looked at in the earlier section.
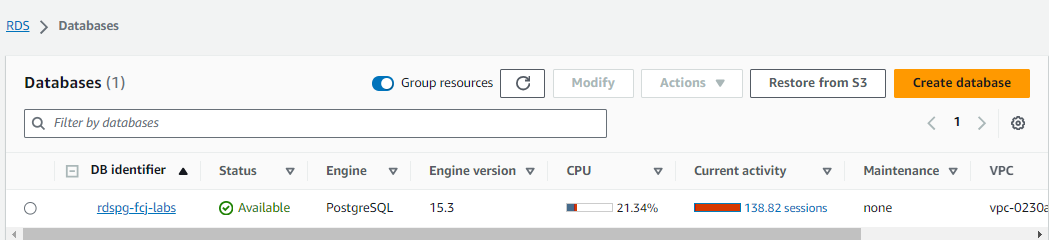
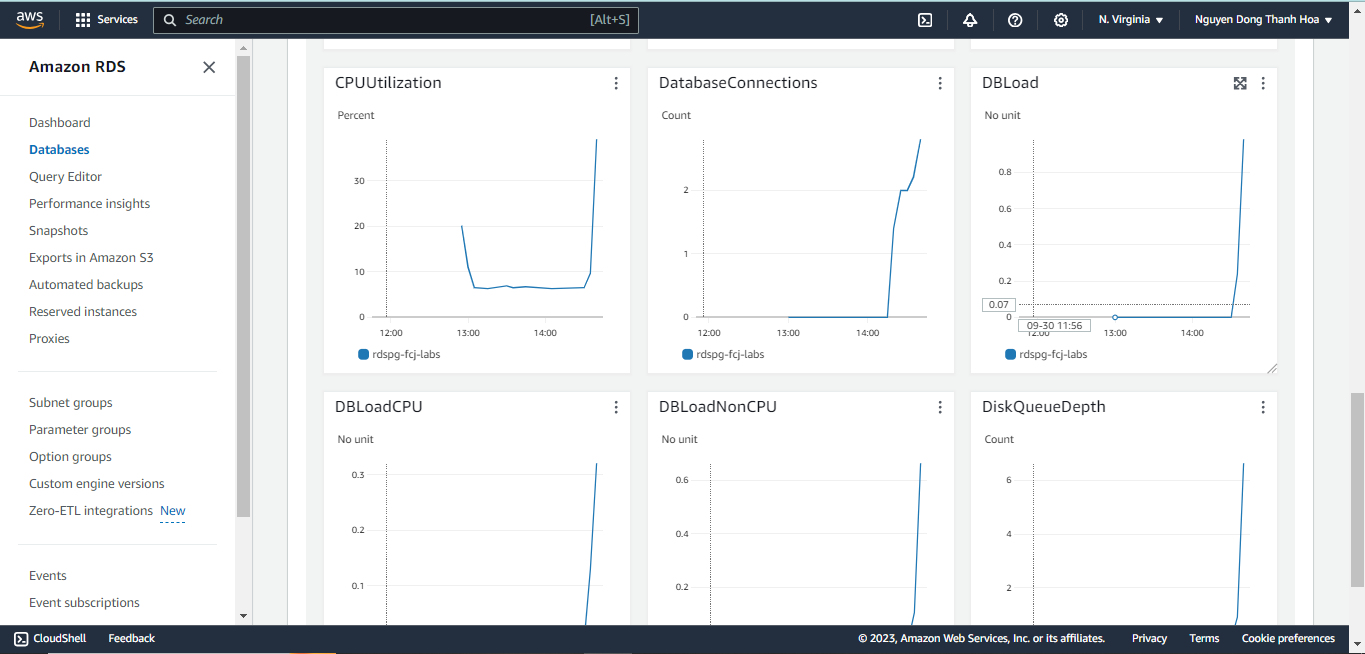
Start by looking at the monitoring tab for the database. You will see some variation in the data with the load test running, for instance you should now see a large increase in the number of database connections.
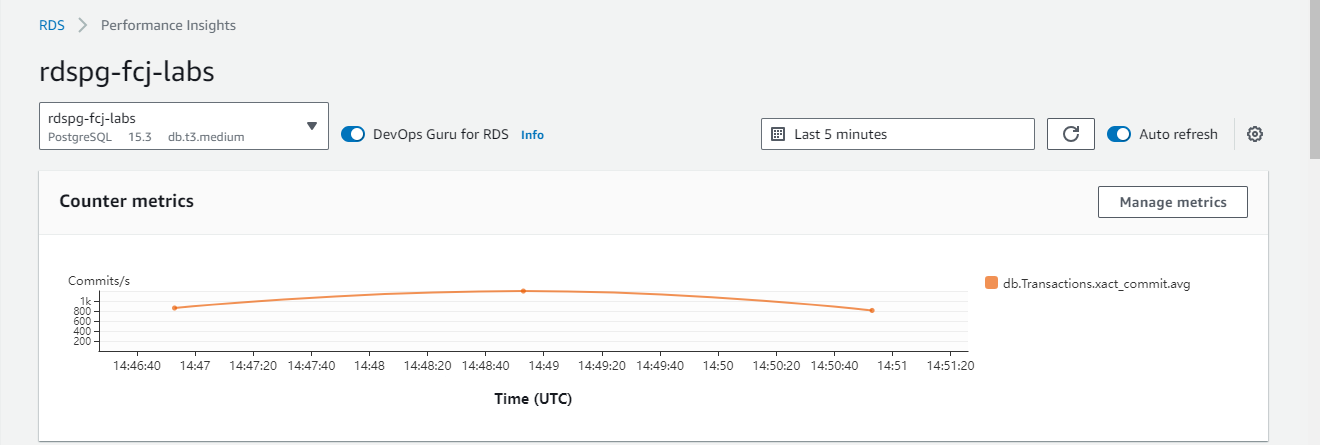
Let’s also take a look at Performance Insights and explore the various charts as our 200 user stress-test runs.
Counter metrics
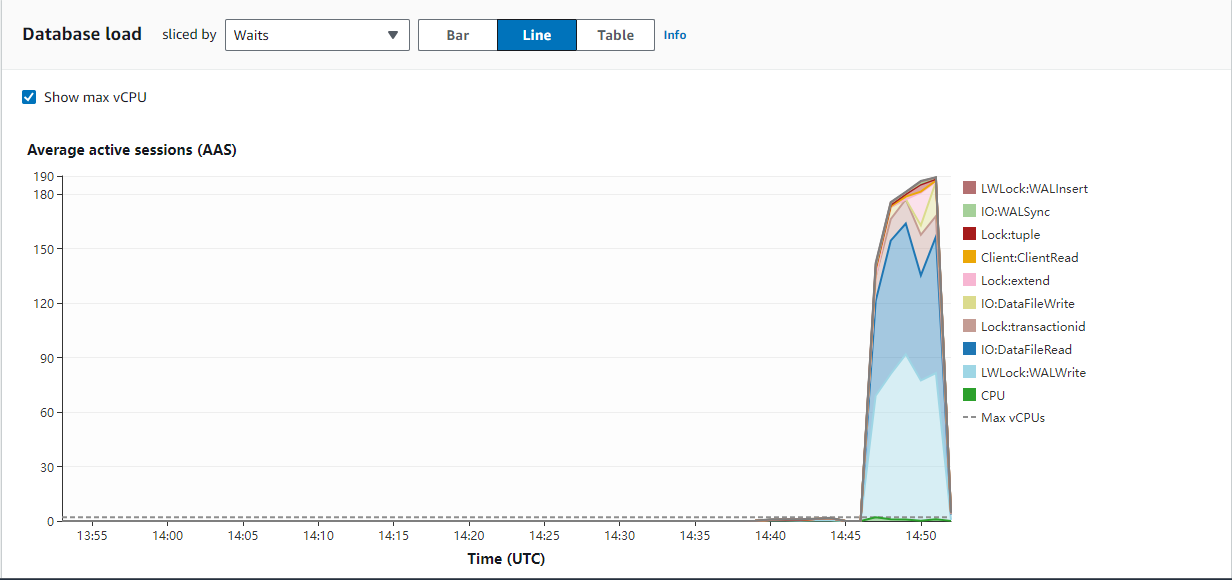
Database load
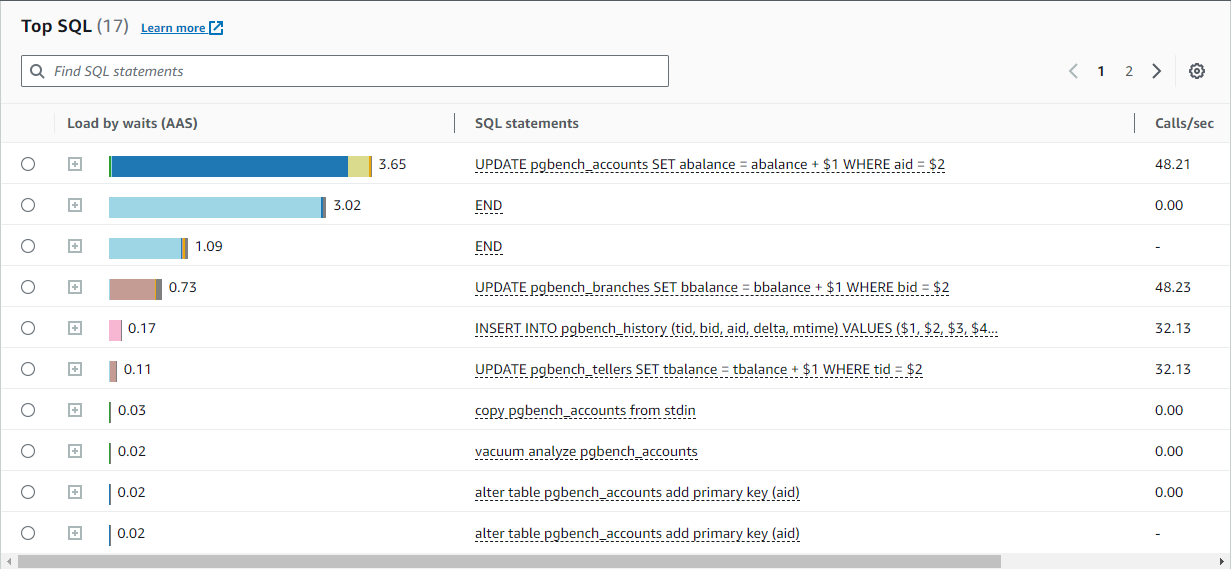
Top SQL
Notice that in the above example, there is a large sky blue area on the Database load graph. The sky blue area corresponds to a large number of database sessions that are waiting on the WALWriteLock & DataFileReadevent.
From a performance optimization standpoint, if we can figure out how to reduce the number of sessions waiting on the WALWriteLock & DataFileRead event, our workload can run faster.
You can learn more about Performance Insights here .
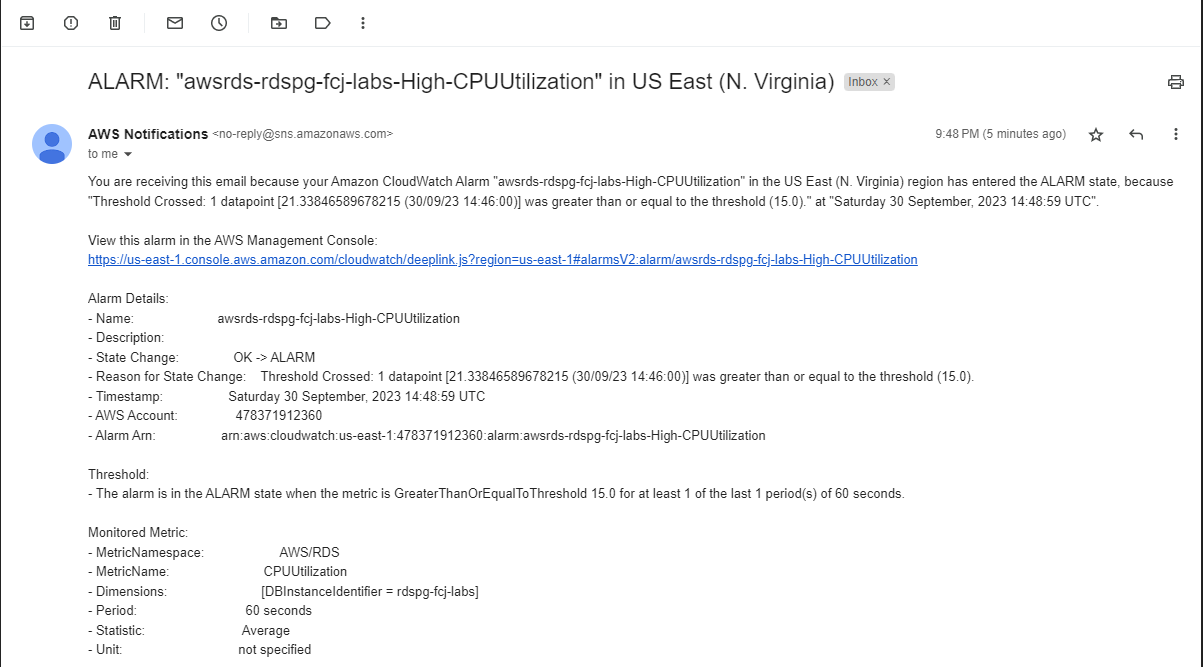
- Check your email. You should have received an email notification about the CPU Utilization alert you setup earlier in this lab.