Reviewing Performance
Now that we have a workload running against our AWS RDS PostgreSQL database, we can take a look at the metrics and dashboards available in CloudWatch and dive deeper with Performance Insights.
In the [RDS Console(https://console.aws.amazon.com/rds/home#databases)] , navigate to the Database instance details page for your database. To view CloudWatch metrics, click on the Monitoring tab. Explore various charts.
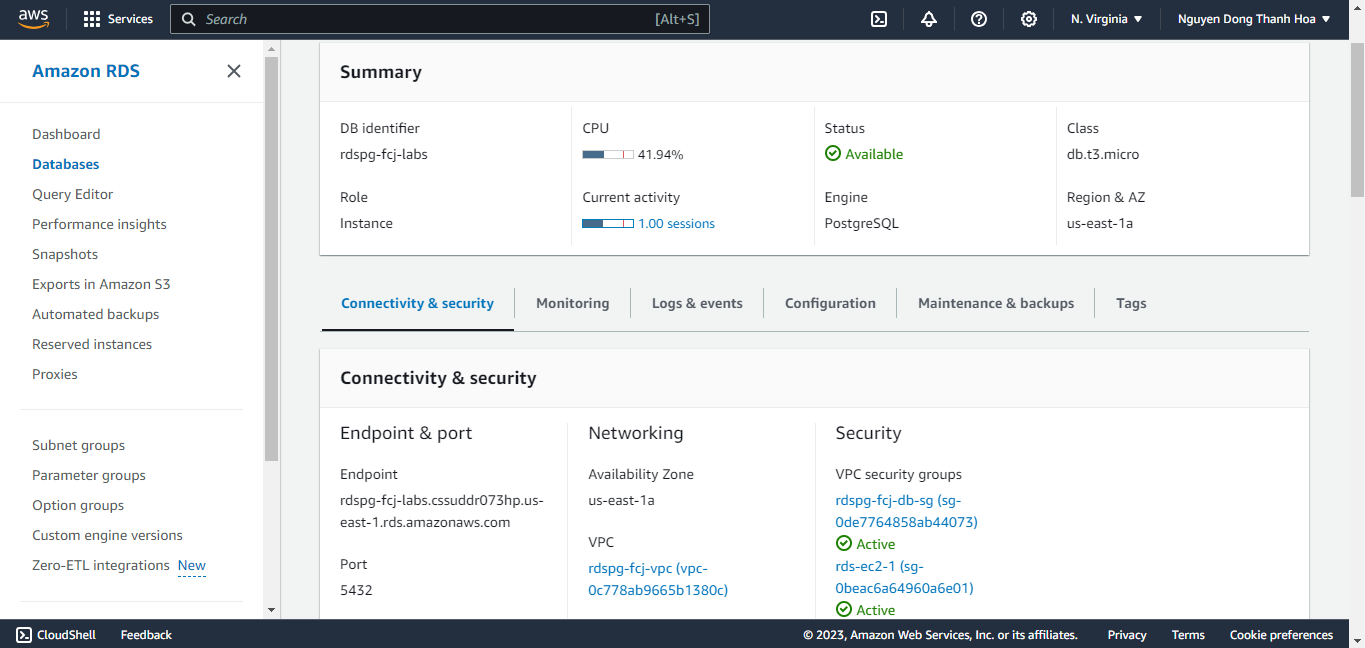
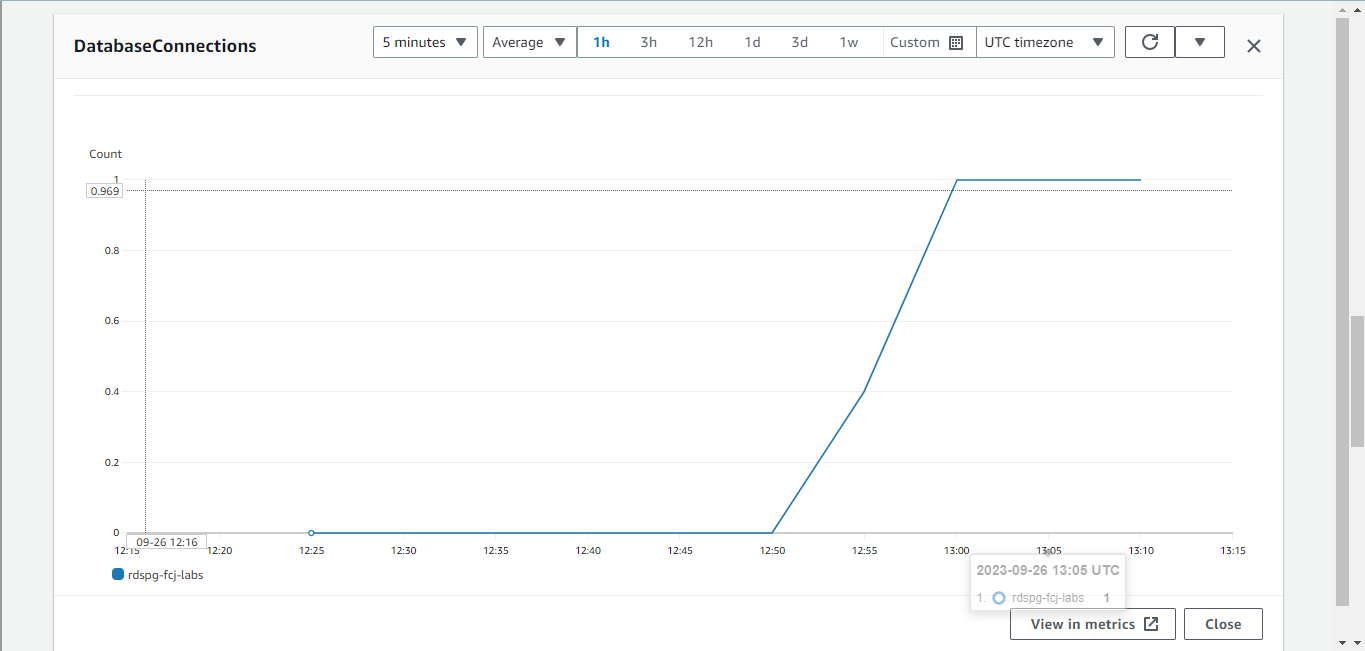
You can click on the chart area of an individual chart to bring the chart full screen and get access to different chart customizations.
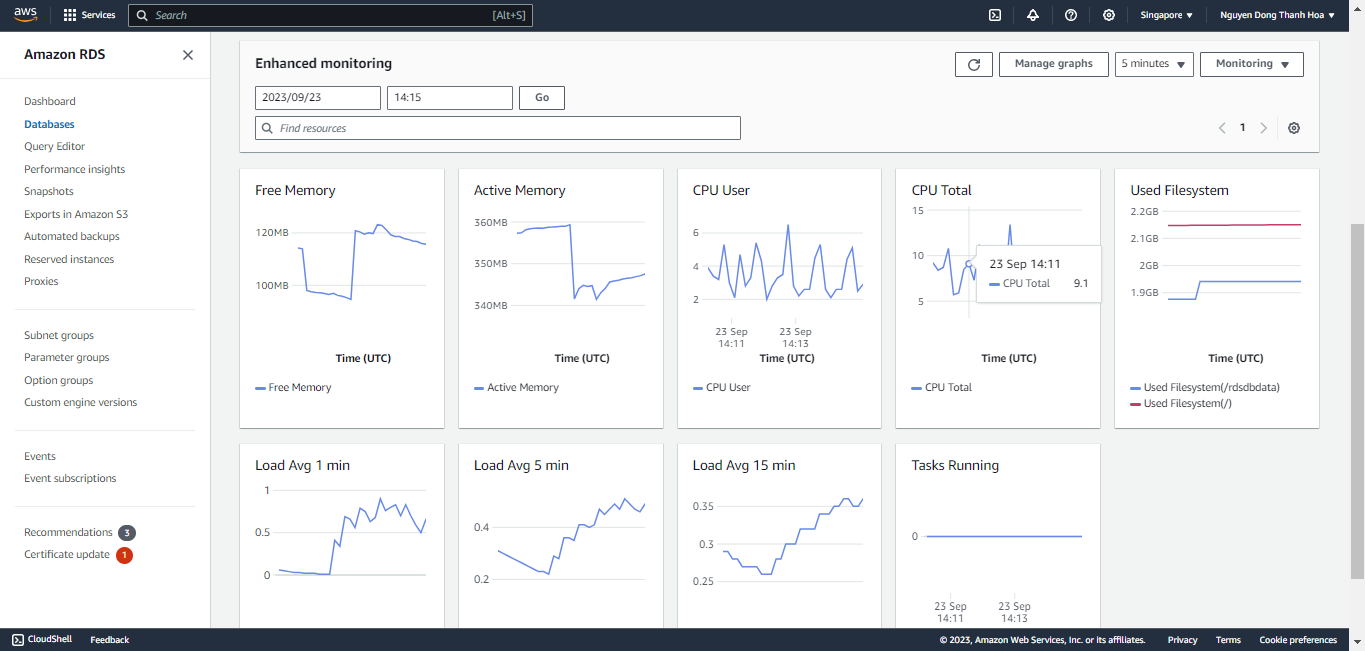
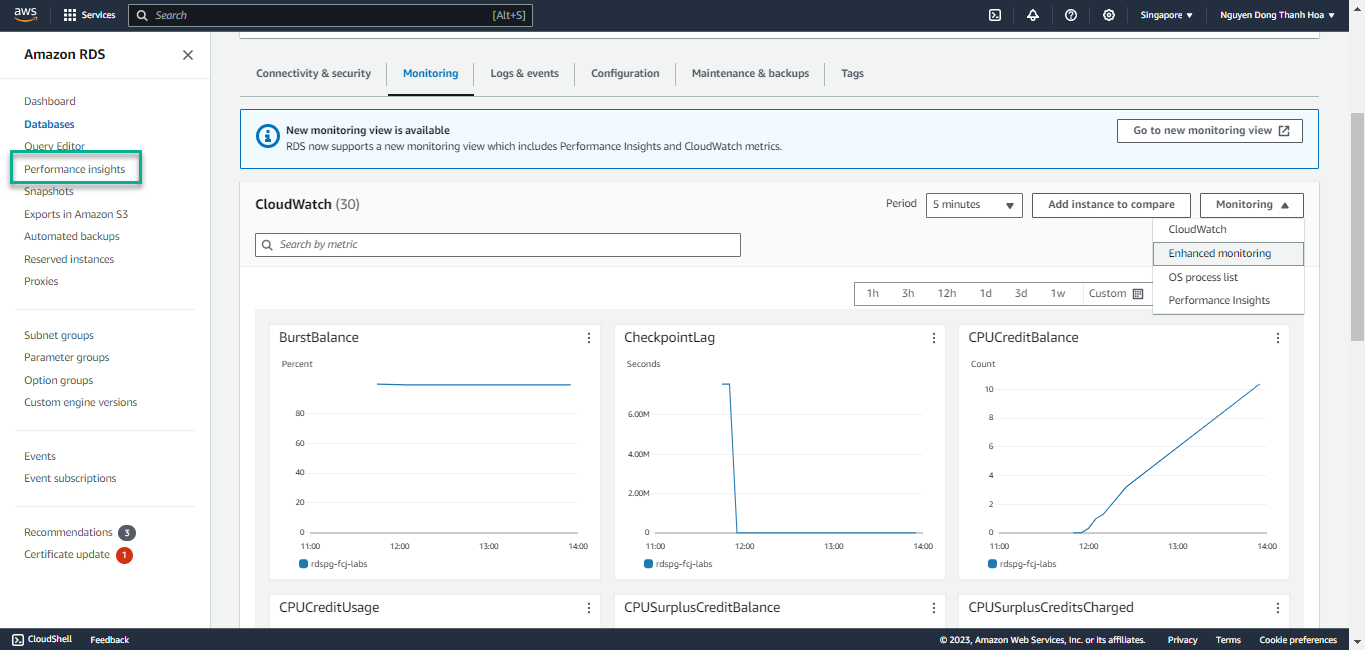
To view Enhanced monitoring metrics, click on the Monitoring dropdown on the right side of the screen and pick Enhanced monitoring and explore various charts.
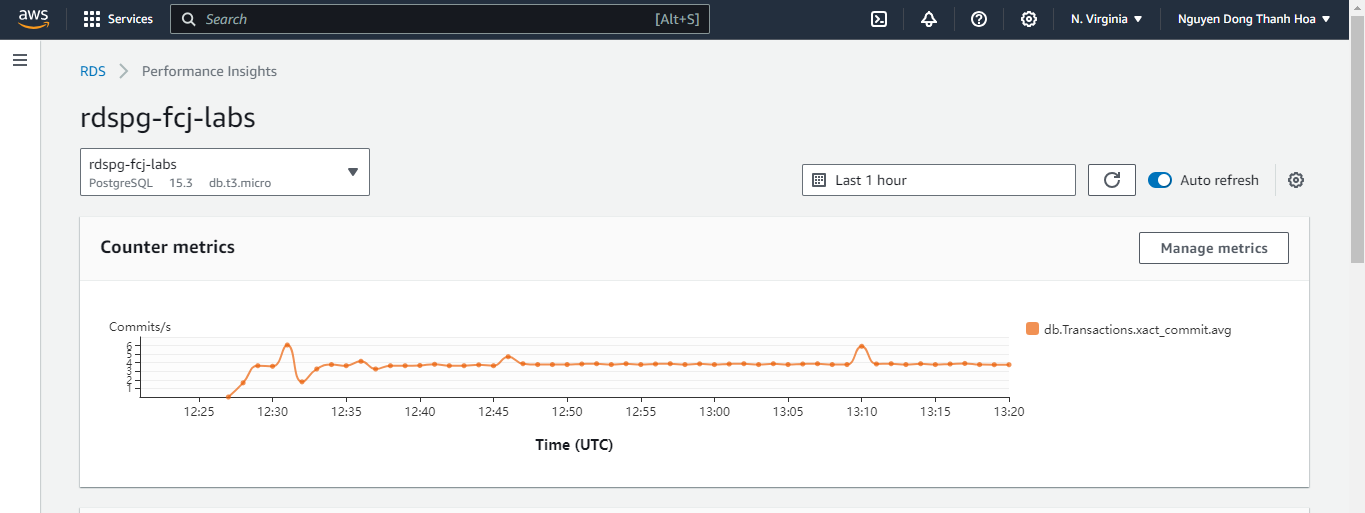
Now look for the Performance Insights link in the RDS console. Right-click on the link and open up Performance Insights in a new browser tab.
Select your database instance and you will notice the load being generated on your RDS instance
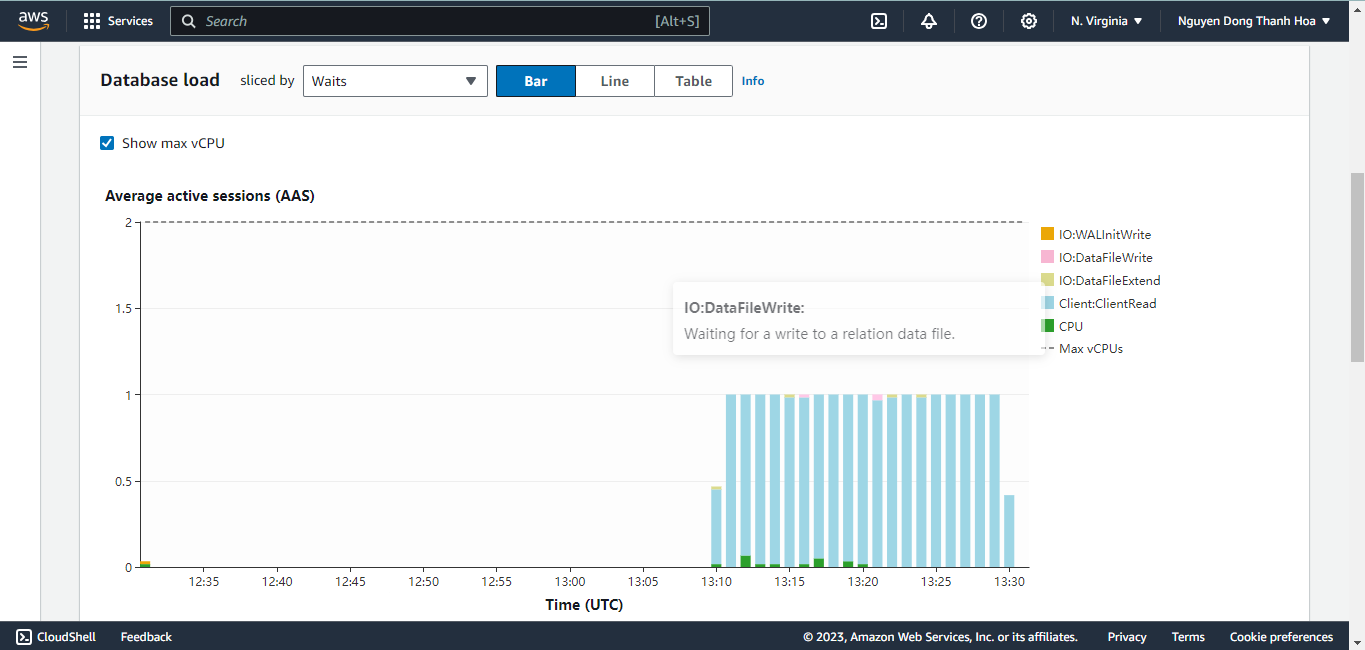
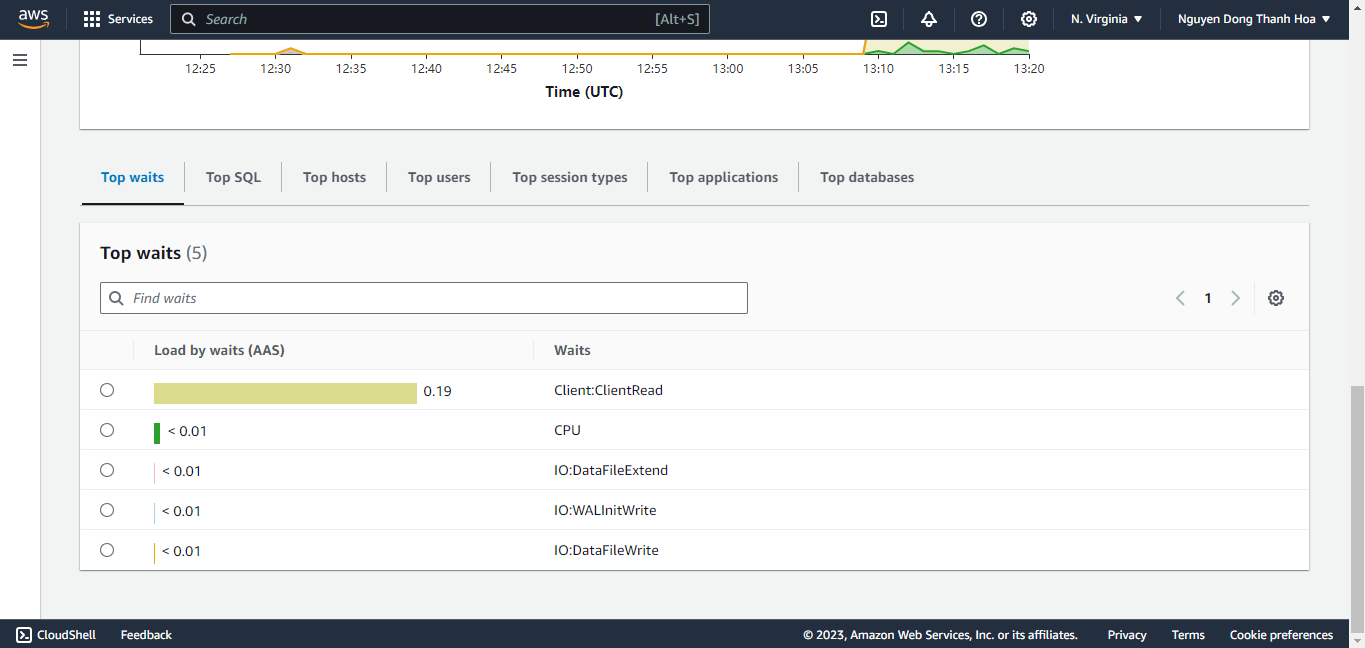
Explore different waits in Performance Insights
 Next we will put a heavy load on the database and revisit these dashboards.