CloudWatch Logs & Alerts
Viewing CloudWatch Logs
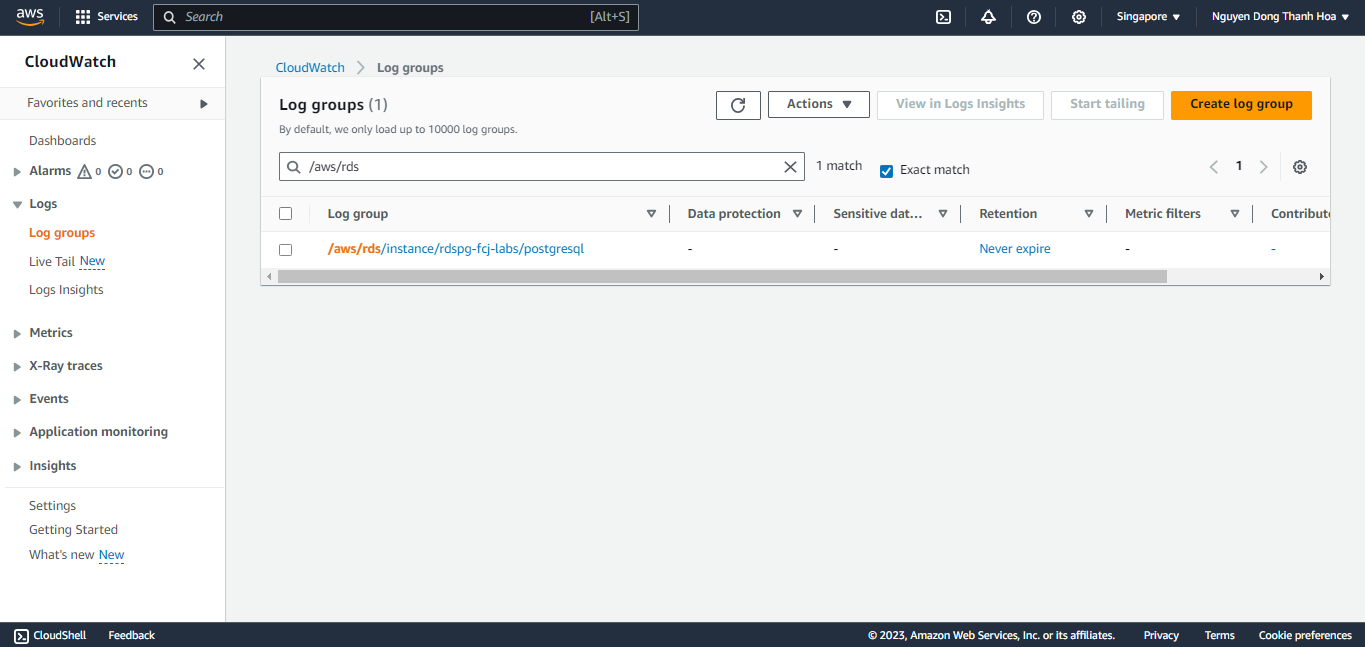
When you created your database in the first lab you selected to publish logs to CloudWatch. Both the database and upgrade logs can be found in a CloudWatch Log Group associated with your database.
Amazon CloudWatch allows us to consolidate logs from various AWS services into a single location to help draw correlations between services, like the application plane and Amazon RDS database.
Open CloudWatch Logs enter /aws/rds into the filter box and hit enter. Select the group assoicated with your database rds-pg-labs and take a look at the log stream.
Creating an RDS Database Alarm
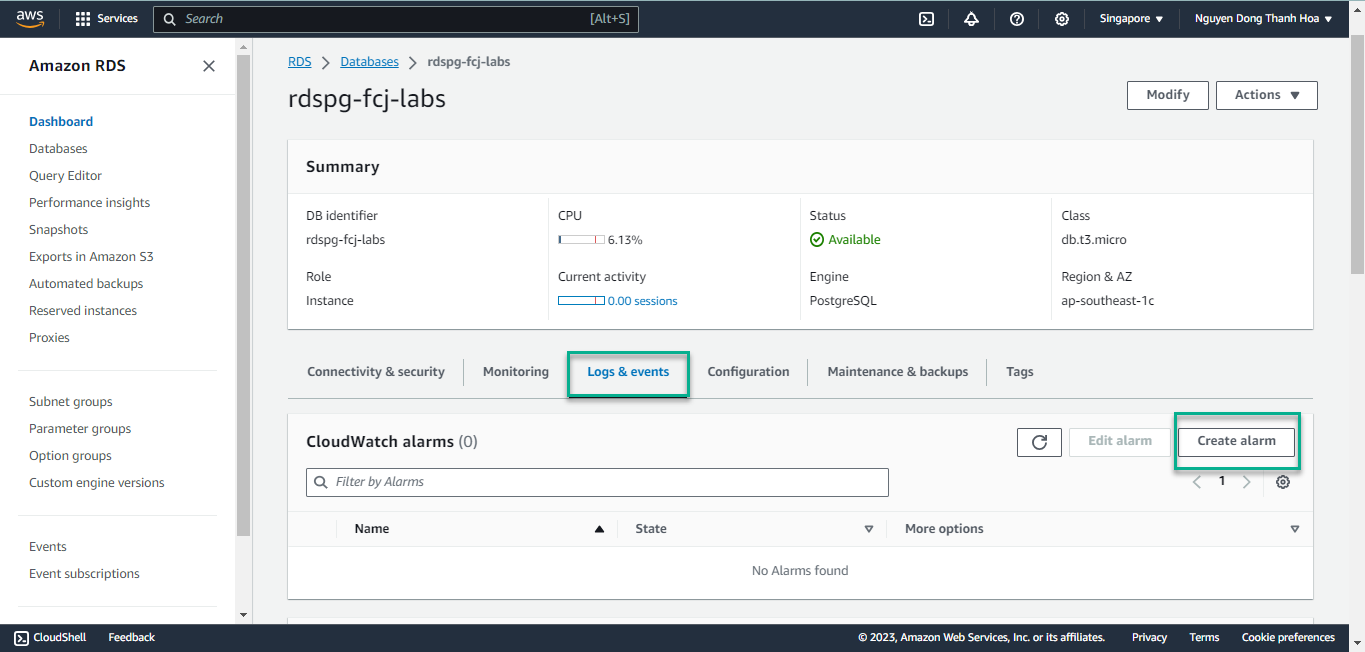
Return to the Database List Click on rdspg-fcj-labs database to go to the details page. The Database detail page has a number of tabs you can look at.
Now go to the Log & events tab and click on the Create alarm button.
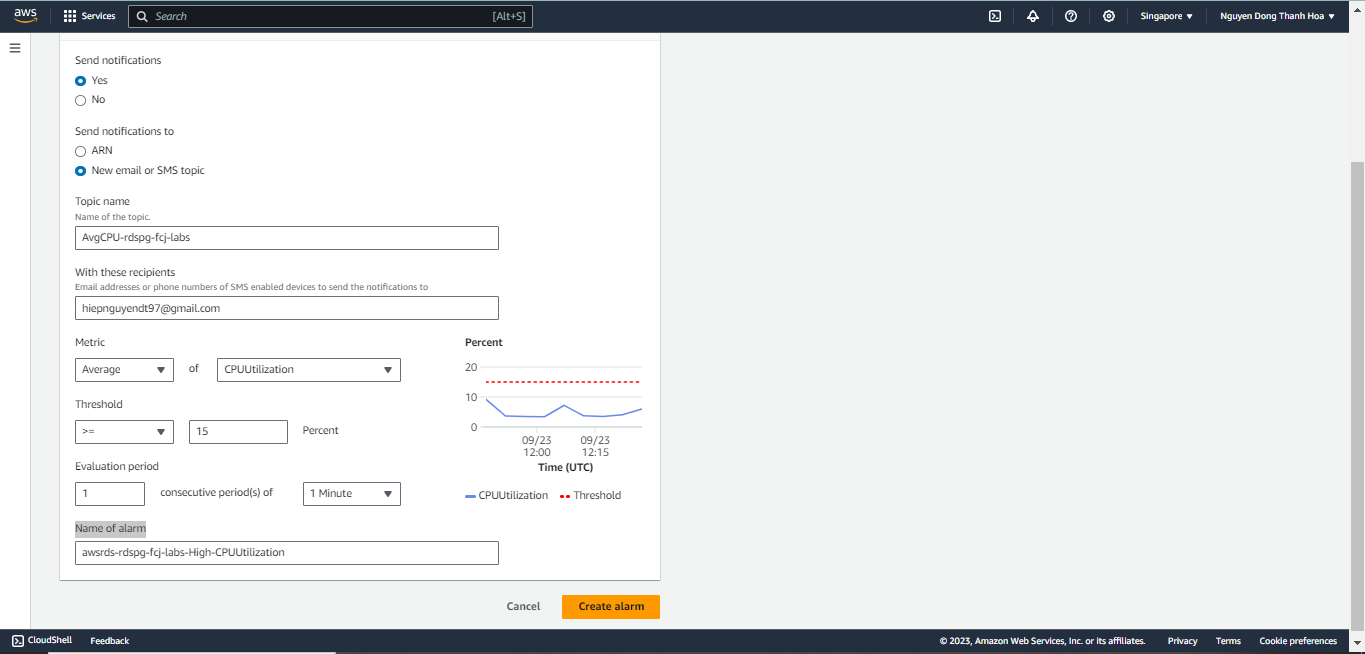
Create a new alarm as shown below.
- Send notifications : choose Yes
- Send notifications to : choose New email or SMS topic
- Topic name : fill yourname topic AvgCPU-rdspg-fcj-labs
- With these recipients: fill your email address
- Metric : choose Average of CPUUtilization
- Threshold : choose >= 15 percent
- Evaluation period : default setting
- Name of alarm : default
Now go to your email client for the email address you supplied for the notification. You should receive a confirmation email within a minute or two. Confirm your subscription by clicking the link in the email.
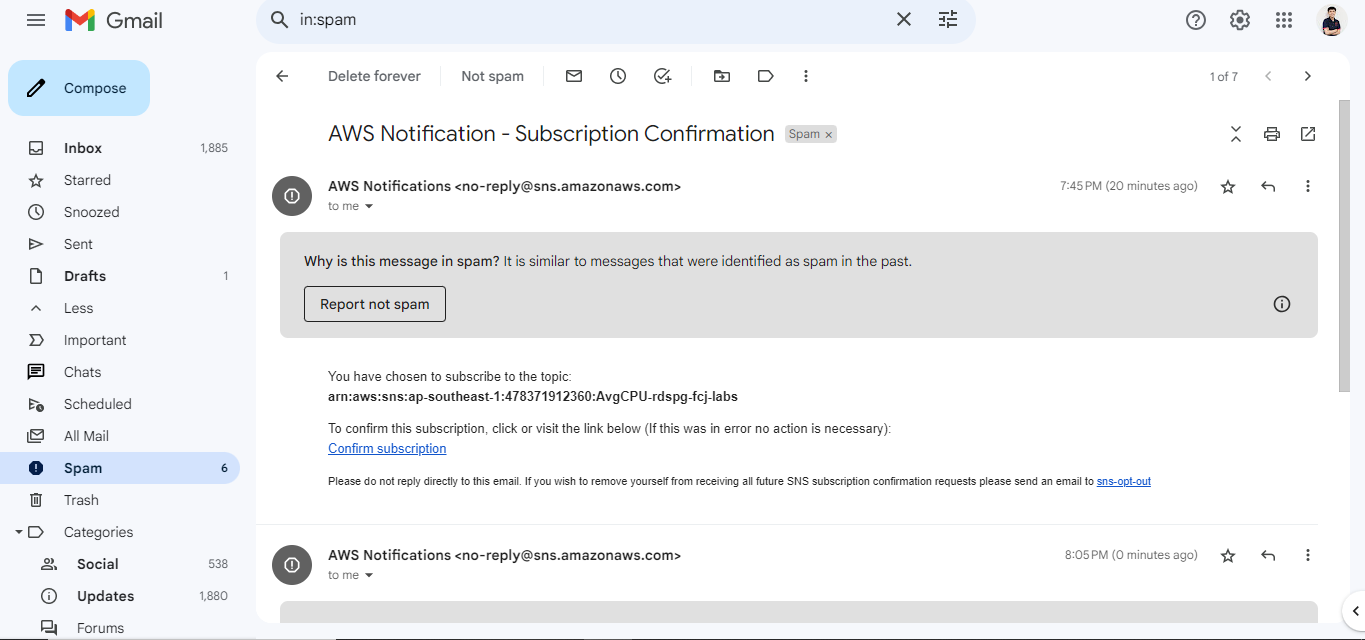
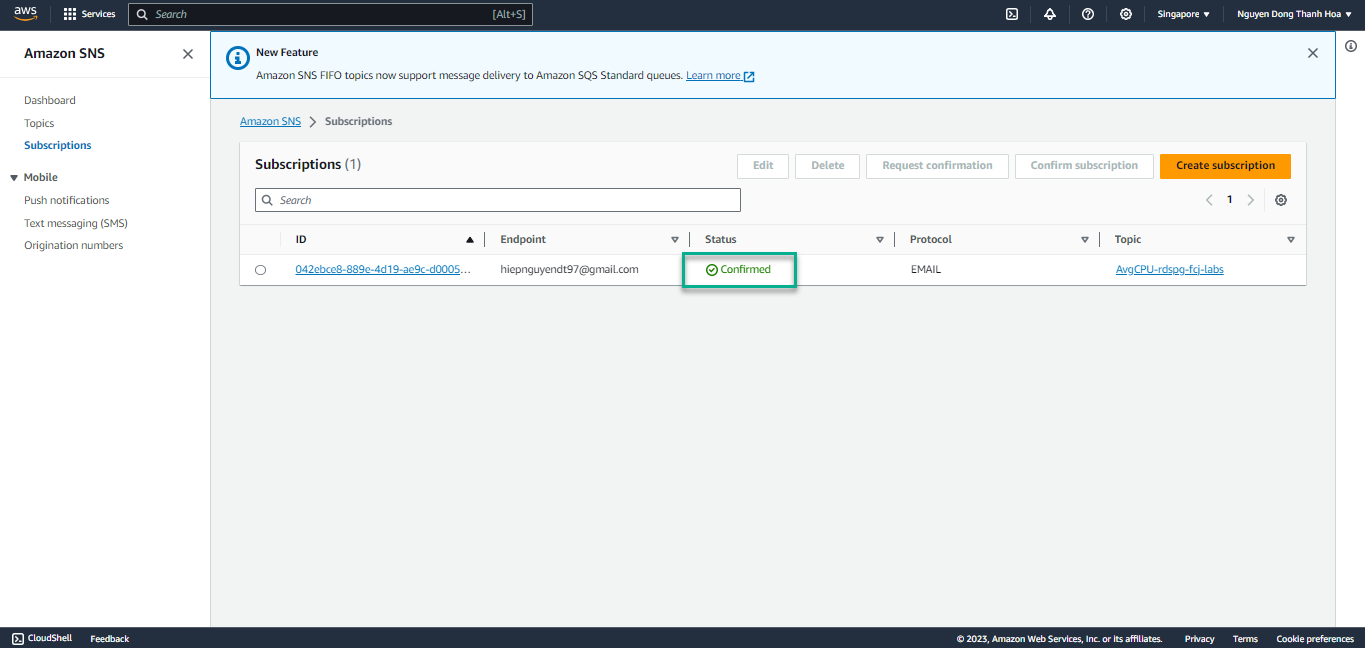
To receive the alarm email that will be generated later in the lab, you will need to confirm your subscription. You should receive a confirmation email from Amazon SNS within 90 seconds or so. Click on the link to confirm your subscription. We will be triggering this alarm in a future section
- Finally, go to AWS SNS Subscriptions to check subscriptions status